Author: Ronald L. Conte Jr.
Abstract
This article analyzes the pattern of seasonality of the human coronaviruses which cause colds, and applies that pattern to predict the increase or decrease in new cases and new deaths for Covid-19 in the approaching months. The result is a rise in new cases, and a disproportionately higher rise in new deaths, due to the increase in the percentage of deaths on top of the increase in new cases. The usefulness of this analysis is predictive, but without precision. If Covid-19 is seasonal, we can know that the winter months will have an increase in cases and an increase in the death rate (not merely a corresponding rise in deaths matching the rise in cases). We cannot know the numbers in advance, although the two studies analyzed herein suggest that a harsher winter results in a higher “wave” of case and death increases in winter for Covid-19.
Study
This article reviews two studies on the seasonality of those types of coronaviruses which cause the common colds. (A third study will be added soon [3].) Here’s the first study:
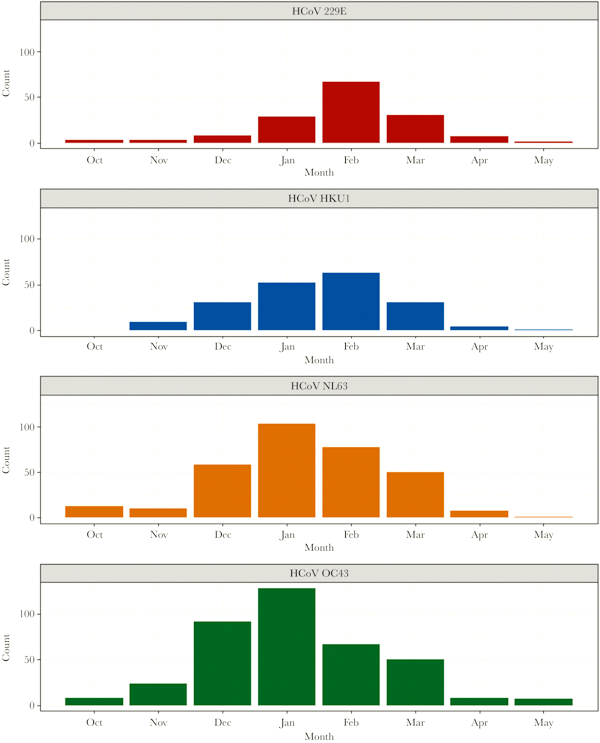
Komabayashi, Kenichi, et al. “Seasonality of human coronavirus OC43, NL63, HKU1, and 229E infection in Yamagata, Japan, 2010–2019.” Japanese Journal of Infectious Diseases (2020): JJID-2020.
PDF file of Study
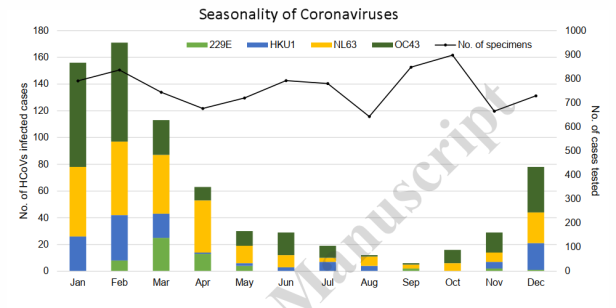
The Chart above, from the Japanese “coronavirus colds” study, finds that the worst months for seasonal respiratory coronaviruses is December, January, February, March, and April — a 5-month stretch when these viral illnesses are common. And the best month by far was September.
The study finds that there is an increase and decrease in human coronavirus cases (in Yamagata prefecture, Japan) based on the season. The importance of the location is that Yamagata has four seasons, including a cold snowy winter and a hot humid summer. And the study does find that coronaviruses are seasonal — to a substantial extent. The viruses are worse in the winter, and have the lowest prevalence in July, August, September, and October.
Why were these viruses so low in prevalence in those four months, with September the absolute low? Those are two months of summer, but also two months of fall. And the fall of Yamagata is short and cool. The likely answer is that the summer weather leads to exposure of the skin to the sunlight, raising vitamin D levels to a great extent. See this previous post on the subject. And vitamin D is a fat-soluble vitamin, stored in the body. So it takes a couple of months, Sept. and Oct., for the stored vitamin D to be depleted.
On the other side of the low months, it takes time for the vitamin D to build up in the human body, and for the compound to spontaneously isomerize to form the needed version of the molecule. So there is a lag in good weather producing higher levels of vitamin D in the blood, and a delay in depleting that vitamin once the weather is cooler.
Therefore, the first month or two of good weather does not have as much of an effect in reducing the case rate. And the vitamin D levels last for a month or two afterward, placing Sept. and Oct. among the better months as well. Then the vitamin D levels in the blood slowly decrease as people spend less time outdoors in the fall and winter. When vitamin D is at its lowest, the virus is at its worst, which is December through March.
Analysis versus Covid-19
If Covid-19 is also seasonal, we will see the same pattern. There will be a decrease in cases from July to August to September, and then a monthly rise, each and every month from October to February. The reason is changing levels of vitamin D in the blood. And if Covid follows the same pattern as the cold-type coronaviruses of the Japanese study, then we should be able to predict, without specific numbers, a decrease from July to August to Sept. and then a repeated set of increases, month by month, until the next spring.
December, January, February, and March are the top of the “wave” of increased cases and deaths for Covid-19. Here is the Chart resulting from applying the ratio of number of cases in each month, as compared to July. The numbers for July are actual values for Covid-19 in the U.S. The other numbers are calculated based on the proportions of one month to another in the Japan study. Do NOT take these numbers as exact predictions. All that is predicted here is the wave, and its general location within the months, not the exact values. (This will become clear as we examine the second study.)
If Covid-19 is seasonal, it will follow the same pattern. Covid-19 will lessen in severity from July to August to September, and then become progressively worse each and every month from October all the way to February.
So let’s apply the Japan study to the data we have for Covid-19. I’ve taken the real-world values for July in the U.S. and then applied the proportions, month to month, from the Japan study, to see what the increase in cases and deaths might be like. Also, as the cases rise, I apply a higher death rate, going from 1.35% (the actual percentage in July) to 4% to 6.6% (the actual percentage in April). See Chart 3 below.
Be Advised: this chart does NOT predict actual numbers, but only that there will be a wave of increased cases and deaths, and what the length of that wave, from beginning to end, might be.
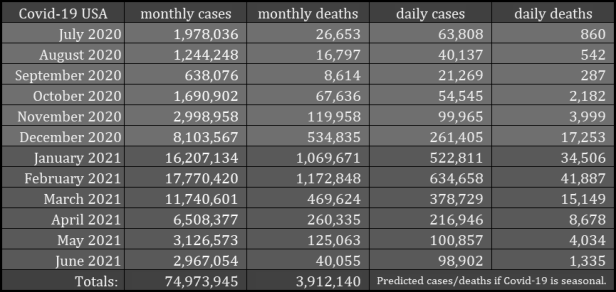
Chart Explanation: The most important thing about the chart is that these should not be understood as exact number predictions, but as a general increase, of unknown magnitude, from month to month. The actual numbers might be less than predicted, or they might be more. This is NOT an attempt to predict exact numbers, but to demonstrate that there will be a wave of increased cases and deaths EVERY WINTER until we defeat the virus!
July numbers are actual, not predicted. All the other numbers were arrived at by using July as the reference and increasing or decreasing monthly cases by comparison to the Japanese study of coronaviruses that cause colds. Monthly cases is the predicted total for that month alone, not cumulative.
Monthly deaths is calculated using one of three different rates: 1.35%, 4.0%, or 6.6%. The death rate decreased from 6.6% to 1.35% from April to July, 2020, calculated by comparing weekly total deaths to the weekly total cases from one week earlier and from two weeks earlier. The numbers showed a gradual decrease from April to July. The reason for predicting a gradual increase is that the pattern of increasing cases shows a decreasing ability to fight the virus, resulting in higher deaths as a percentage of the cases. July, August, September used 1.35% as the death rate; October, November used 4.0%; December, January, February used 6.6%; March, April, May used 4.0%, and June of 2021 used 1.35%. In reality, the death rates will rise and fall more gradually, but these are monthly approximations.
Daily cases and daily deaths are simply the monthly figure divided by the number of days in each month, 28 or 30 or 31. Note that we should expect the actual values for daily new cases and daily new deaths, in a month that is higher than the previous month and lower than the subsequent month, to rise from day to day within that month. And vice versa for a month where cases and deaths are falling.
Actual values will not be the same as this prediction. One difference may be which months are included in the worse season, and which in the better season. Hopefully, the bad season will be narrower. Another difference will be in the height of the curve: how bad will it be in the peak month of February? The ratio of February total cases to July total cases in the prediction is 9.0x. Hopefully, that peak will be lower. If it is 7.0x or 5.0x or only 3.0x all the other figures will also be lower. So as Nov. and Dec. unfold, we’ll have a better idea of the height of the wave.
Notice the vast difference in the above Chart between September and February. If the Covid-19 case rate or fatality rate follows this pattern, we need to be prepared. The current U.S. deaths are as high as 1000 to 1500 per day, against a case rate of 50 to 70 thousands. The seasonal pattern means three things:
1. The number of new cases per day will be much higher,
2. The number of new deaths per day will also be higher,
3. And the death rate will be higher, making total deaths disproportionately higher as compared to the cases.
That third point is important. Right now, the daily new deaths is less than 2% of the daily new cases. August 1st saw 58,541 new cases and 1,123 new deaths that day, which puts deaths at 1.9% of cases (same day basis). But if Covid-19 is seasonal, not only will cases and deaths go up as numbers, but the deaths will go up as a percentage also.
This is partly due to the increase in cases, but also due to an increase in the rate itself, the case fatality rate (deaths/cases). And the number of new deaths will not be 2% of the new cases, but as much as 6.6% of the new cases. That was the death rate in April of 2020. We have seen a decrease in the rate from April to July. But the rate could rise, as it depends on many factors.
Amsterdam Study
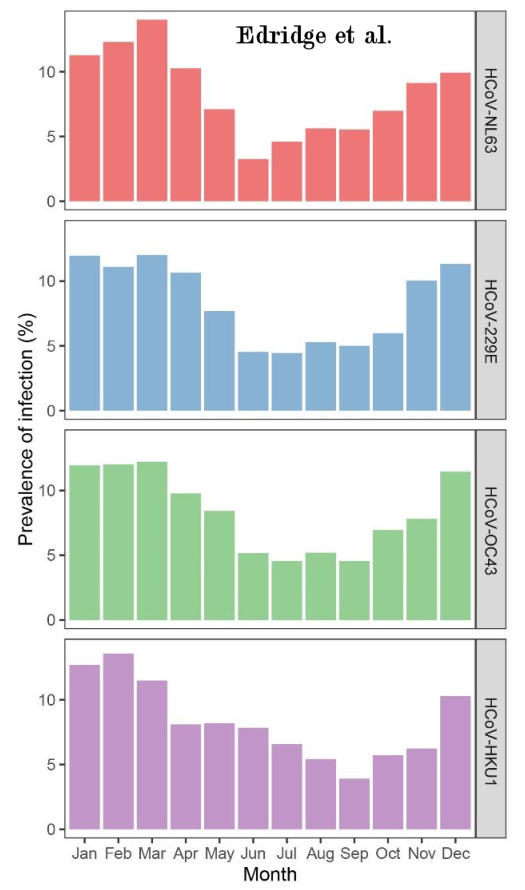
Another study of the same four cold-type coronaviruses, by Edridge et al., also found that the case rate is seasonal:
Edridge, Arthur WD, et al. “Coronavirus protective immunity is short-lasting.” MedRxiv (2020). PDF of Study
Here is the chart from that study, performed in Amsterdam, showing the changes in the case rate, month by month, from January to December. Edridge et al. state: “the spring and summer months May, June, July, August and September show the lowest prevalence of infections for all four seasonal coronaviruses….” [Edridge, 2020] By comparison with the above-discussed Komabayashi study, the months with the lowest prevalence are off-set by one month, being June through October.
In my analysis of the above chart, I joined the data for all four viruses in the Edridge study, and, using July as the reference month (with actual figures for Covid-19 in those months), I applied the ratio of each month in comparison to July to calculate values for the other 11 months for Covid-19. See the chart below. The death rate is per month. Three different case fatality rates are used: 1.35%, 4%, and 6.6%. The lower and higher of those values are actual percentages from July (1.35%) and April (6.6%) for Covid-19 in 2020.
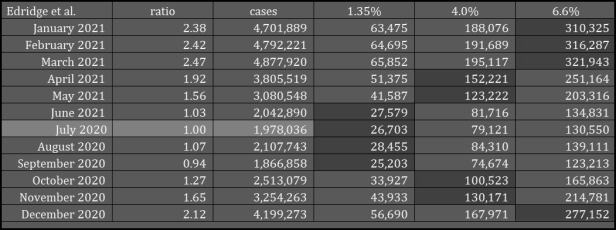
The monthly case rate in the above chart goes from a low in September of 94% of the July reference value, up to a high in December through March of 2.12, 2.38, 2.42, and 2.47. April is just below 2x at 1.92. The calculated case values are close to 5 million cases in March, and not much lower than that in February and January.
The Komabayashi values have a much higher ratio in the peak months, with February about 9 times July, compared to only 2.47 times July in March for the Edridge data. But in both cases there is a WAVE in the winter, an increase in the number of cases of the coronavirus. The height of the wave differs between the two studies, along with the length of the wave, i.e. how many months have these elevated values for case rate.
Why was the winter increase in cases lower in the Amsterdam study and higher in the Japanese study? It may be because Amsterdam has a milder winter than Yamagata province, where the Japan study was done. And this would imply that regions which have harsher winters will have more Covid-19 cases during the approaching winter Second Wave.
But my conclusion is not that the Second Wave of Covid-19 will have the values of Chart 3, from the Japanese study, nor the values from the Amsterdam study in Chart 4. Instead, the values will vary from one region to another. But in any case, the Winter Wave will be too many cases for the healthcare system to handle. In the U.S., July saw nearly 2 million cases. If this analysis is correct, the high values for monthly cases this winter could be 1.5 to 2.5 times July (3 million to 5 million cases per month), or it could be closer to the Japan study, with anywhere from 3 to 9 times July (6 million to 18 million cases per month). Any increase beyond 2 million cases a month is too many.
A Third Study: Michigan
The winter in Amsterdam is milder than in Yamagata, and the wave of increased infections from the seasonal human coronaviruses in Amsterdam is also milder. The next study [3] was done in Michigan, where the winters are colder than in Yamagata [4]. And the pattern continues to show that colder winters mean higher incidence of a seasonal coronavirus. For the four human coronaviruses that cause “colds”, The peak of the infection season was either January or February, and peak months compared to autumn lows were a large multiple.
The four viruses are 229E, HKU1, NL63, and OC43. The multiples were 19.1x, 7.1x, 8.5x, and 16.5x [3]. That is an average of 12.8 times, when comparing peak month for viral infections to the autumn low month. To put that in perspective, if we take the number of cases from July, 2020 of Covid-19 — 1,978,036 cases — and multiply by 12.8x, we get 25.3 million cases in the peak winter month. That would be devastating and it would break the healthcare system.
Fortunately, the U.S. does not have Detroit, Michigan weather across the nation. On the other hand, Detroit weather is not so different from New York, Boston, and many other cities and States. But as a nationwide average, we might be most comparable to Amsterdam (2.47x at peak), than Yamagata (10.5x) or Detroit (12.8x). [The Yamagata multiple is Feb. compared to Oct., rather than July, so as to be most similar to the other two values.]
Even so, a 2.5x peak month this winter would mean about 5 million cases. It would also mean a higher death rate against those higher cases. So if we take the case fatality rate in the U.S. for the month of April, 6.6%, and apply it to a 2.5x increase in cases for the approaching peak winter month (probably Jan. or Feb., but possibly Mar.), we get 330,000 U.S. Covid-19 deaths in that one month alone! And that is using the lowest peak multiple value from the three studies.
Size and Shape of the Wave
The “wave” of increased deaths from Covid-19 this winter is of particular concern. Will the wave have a larger height (i.e. greater number of deaths), like the Detroit or Japan studies, or a lower height, like the Amsterdam study? The chart below compares Amsterdam and Japan (Yamagata). The curve for Detroit would be off the chart.
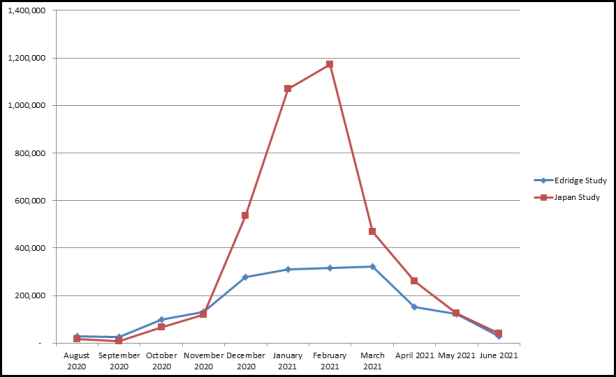
The difference is in the extent of the deaths during the worst part of the winter season. Either scenario is possible. However, the actual wave will differ from one region to another, and may be in-between these two sets of values.
Worst Case Scenario
However, it could be worse. If the healthcare system is overwhelmed, and collapses, the death rate could reach 10% to 20% of reported cases this winter. We have not seen anything like what is coming. Mark my words.
If Covid-19 is seasonal, the new cases will be over 150,000 per day, and the new deaths will be in the tens of thousands per day. If Covid-19 follows the pattern of other seasonal coronaviruses, as in the above studies, we will need to prepare well to avert a collapse of the healthcare system.
Understand this: Even if the figures are substantially incorrect, IF Covid-19 is seasonal, without any doubt, this winter will be very difficult! Instead of the height of the wave being 2.5x as in the Amsterdam study (Edridge), it might be as high as the 9.0x of the Japan study (Komabayashi). In either case, the hospital system might break. We cannot take a series of months this winter in which the cases and deaths are a multiple of July. We are losing doctors and nurses. We are way beyond maximum capacity.
Note Well: if the hospital and healthcare system falls apart under the weight of the increase in cases, because they did not prepare, the death rate for Covid-19 could be higher than in the chart based on the Japan study.
AND SO WE ABSOLUTELY CANNOT WAIT UNTIL DECEMBER TO ACT!!
Preparations for the massive second wave will require 60 days. If we don’t start on October 1st or sooner, we will lose a large number of lives unnecessarily. A future article will describe what needs to be done.
Ronald L. Conte Jr.
Covid.us.org
Note: The author of this article is not a doctor, nurse, or healthcare provider, and this article does not offer medical advice.
Consider supporting Covid.us.org with a one-time or recurring donation via PayPal
1. Komabayashi, Kenichi, et al. “Seasonality of human coronavirus OC43, NL63, HKU1, and 229E infection in Yamagata, Japan, 2010–2019.” Japanese Journal of Infectious Diseases (2020): JJID-2020.
PDF file of Study
2. Sajadi, Mohammad M., et al. “Temperature, Humidity, and Latitude Analysis to Estimate Potential Spread and Seasonality of Coronavirus Disease 2019 (COVID-19).” JAMA Network Open 3.6 (2020): e2011834-e2011834.
Link to Study
3. Monto, Arnold S., et al. “Coronavirus occurrence and transmission over 8 years in the HIVE cohort of households in Michigan.” The Journal of infectious diseases (2020). Study Link
4. Wolfram Alpha, “Compare Temperatures of Two Cities” widget, Detroit, Michigan versus Yamagata, Japan.
5. Edridge, Arthur WD, et al. “Coronavirus protective immunity is short-lasting.” MedRxiv (2020). PDF of Study
